
In the field of tribology, the word “particles” means different things to different people. The following case studies illustrate how differently the mechanical engineer, tribologist, sampler, analyst and diagnostician interpret the presence of particles.
The Mechanical Engineer and Tribologist
To the mechanical engineer and tribologist, the presence of particles is an indication that contaminants have entered the system or that certain components are wearing abnormally. Particles that are smaller than the minimum clearances could result in abrasive wear, which in turn causes premature aging or failure. Large particles could result in blockages of oil channels, which could lead to oil starvation. Thus, both conditions spell trouble to these role players.

This illustration shows how particles cause damage
to parts in contact. (Ref. Triple-R Oil Cleaner)
The Sampler
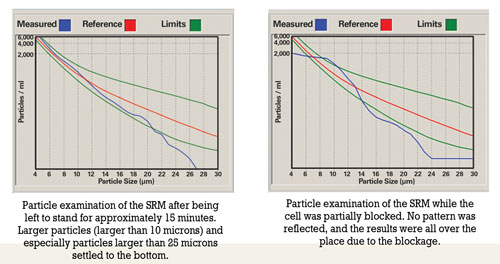
The main concern of the sampler is to produce a homogenous sample that is representative of the bulk volume of oil in the system. The presence of particles complicates the task of the sampler, as particles tend to settle at the bottom of the tank/sump.
Prior to sampling, oil should be hot and well agitated to ensure that the sample includes particles that have settled. For routine oil analysis, the container must not be filled more than 80 percent to enable the laboratory to agitate the sample prior to analysis.
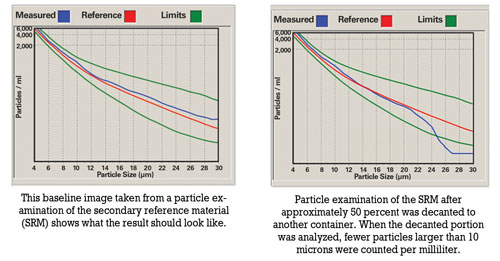
Improper sample handling includes overfilling containers, decanting samples that were originally filled to the top and sampling when the oil has not been circulated sufficiently prior to sampling. Overfilling a container leads to insufficient agitation. Shaking the container prior to decanting will result in large particles remaining at the bottom of the container. There’s also the possibility that the less contaminated portion is decanted, causing the laboratory result to be higher than usual.
The Analyst
Once the samples reach the laboratory, the presence of particles directs the tasks and methods that the chemical analyst will use to analyze the samples. The method of sample preparation, the analytical techniques and instrumentation required to ensure that the results are representative of the condition existing in the application all depend on the type, size, properties and distribution of the particles present in the samples.
Various analytical techniques, including inductively coupled plasma (ICP) spectrometers, the flow cell of Fourier transform infrared (FTIR) spectrometers and some particle counters, rely on peristaltic pumps and transport systems (tubing) to introduce samples to the various instruments. When large particles are present in samples, the possibility exists that the tubing could become blocked.
| 68% | of machinerylubrication.com visitors view the presence of particles as a valuable indicator in an oil analysis sample |
Analysts also must be aware of the tendency of particles to settle at the bottom of the container. Prior to each analysis, samples should be agitated sufficiently to ensure a homogenous state. Lowering of the fluid’s viscosity either due to fuel dilution in the engine or dilution due to analytical requirements (e.g., ICP) aggravates the tendency of particles to settle. With ICP analysis, the samples must be diluted to assist with the transportation process. Due to dilution, suspended particles are more prone to settle out on the bottom of the test tube and will not be available for analysis. However, no dilution is required with rotating disk electrode (RDE) analysis.
The Diagnostician
Particles can be of value to a diagnostician who studies the shape and nature of particles found in a sample. A scanning electron microscope (SEM) can assist in investigating the root cause of mechanical failure by allowing the diagnostician to pay special attention to evidence such as scratch marks on particles and methods of particle formation.
Fine filtration is a proactive process aimed at removing contamination and wear particles from the system. If this process is not executed with special care, knowledge and sensitivity to the value that particles add for the diagnostician in root-cause analysis, crucial evidence can be lost.
Case Study #1: RDE vs. ICP Spectrometry
In 2002 the Eskom laboratory changed from ICP to RDE spectrometry to perform wear metal analysis on used oils. To obtain a new baseline, it was essential to perform both spectrometric methods as well as the ferrous particle quantifier (PQ) on all samples received for a three-month period.
When the spectrometric results were plotted against the PQ values, it was determined that the higher the PQ value was for a sample, the greater the difference between the ICP and RDE results. For a PQ value of 15 milligrams of iron per liter (mg/l Fe), the expected difference between the two techniques was about 0 to 5 ppm. However, above a PQ value of approximately 75 mg/l Fe, the relation seemed to become non-linear, where the differences between ICP and RDE results were from 50 to more than 500 ppm.
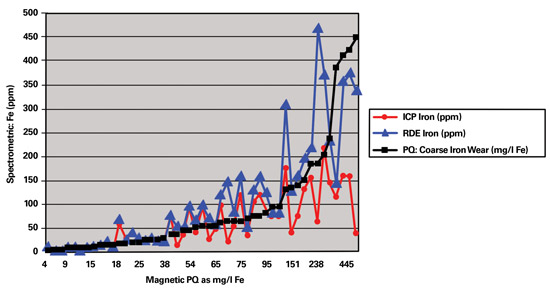
This graph charts the relationship between RDE and ICP relative to PQ
as determined on samples of different sources.
One sample with a PQ value of 1,712 mg/l Fe had an iron value of 699 ppm with ICP. The result on the RDE for this same sample was found to be in the region of 3,000 ppm. The difference in results obtained by the two spectrometric methods was as high as 2,300 ppm.
When the wear trends of the unit with the PQ value of 1,712 mg/l Fe were examined, the ICP results gave the impression that the problem was either resolved or stabilized. However, when the RDE results became available, it was evident that there was an increase in wear. The final report recommended the unit be shut down for emergency maintenance.
Due to the lower particle size limitation of the ICP, a plateau was reached much sooner than with the RDE. Applications most affected by the ICP’s lower size limitation were those that did not have internal oil filtration systems such as gearboxes and certain compressors.
Geometry of the particles being analyzed by the RDE also affected the results. For example, if thin flakes of metal were present in the sample, flakes that had flattened out on the RDE gave a different reading than particles that had not flattened out. Thus, the results on the RDE varied due to the particle size as well as the geometry of the particles.
Case Study #2: Severe Scratching in a Locomotive Engine
The engine of a particular locomotive was replaced with a newly refurbished engine. When the engine was installed, the maintenance team had difficulty eliminating abnormal vibration in the engine. Eventually, it was determined that a bent flywheel caused the vibration.
As soon as the vibration problem was eliminated, scratching noises were audible. Everything was checked, yet the source of this noise could not be traced. The maintenance engineer decided to involve the laboratory that performed the oil monitoring program in the investigation.
Since the engine was recently refurbished and the original source was unknown, the laboratory had no history on which to base the diagnosis. To obtain more knowledge about the solid content of the oil sample, the lab employed specialized methods, such as the electron diffraction X-ray (EDX) scan technique using the SEM.
To find out if the noise was due to insufficient lubrication, the laboratory determined the oil’s viscosity. This was to establish if metal-to-metal contact had occurred as a result of the oil being too thin. A new oil sample of the specified lubricant was submitted for comparison with the oil sample taken from the engine.
A PQ analysis was then conducted to determine the magnetic property of the oil, followed by spectrometric elemental analysis using RDE spectrometry. An EDX scan using the SEM was performed on particles caught after the sample was filtered through a 0.8-micron-filter membrane and rinsed with pentane to remove oil residue.
The results revealed that the viscosity was acceptable when compared to that of the reference sample, while the PQ values were very high (more than 1,000 mg/l Fe). The RDE spectrometric analysis indicated an increase in copper, iron and zinc when compared to that of the reference sample.
The EDX scan using the SEM found the following components on the filter:
- High occurrence of white metal bearing material
- Metal frets
- Iron, lead and copper shavings with scratch marks
- Metallic iron shaving with lead bound to it
- Zinc particles not in combination with copper
- Mineral/rock/soil containing calcium phosphate
- and calcium silicate
- Silicon and aluminum silicate
- A piece of silicone
Ionization Energy and Spectrometric Analysis
The available ionization energy to energize large particles reaches a plateau, which is one of the reasons different spectrometric methods have limitations concerning particle size (3 microns maximum for ICP and 8 to 10 microns maximum for an RDE spectrometer).
Spectrometers, as they are applied today, are blind to large particles. Traditional methods of determining large particles (larger than 10 microns) are acid digestion (expensive and hazardous), microwave digestion (expensive and time consuming) and direct ferrography (does not include non-ferrous metals).
Rotrode filter spectroscopy (RFS) was developed to provide an improved spectroscopic method for analysis of used oils for condition monitoring/predictive maintenance without the particle size or metal-type limitations of previous combined spectrochemical and direct ferrographic techniques.
Particles as Enemies
Special evidence, such as the scratch marks on the metal frets, suggested that uneven objects (particles) were responsible for abnormal wear of the liner and/or the crankshaft. The piece of silicone found indicated overuse of a silicone-containing substance like a sealant, which possibly was squeezed out between parts, cured and ripped off by the hot flowing oil. These silicone pieces could have blocked oil passages, resulting in a damaging situation of oil starvation.
Particles including silicon (quartz) and sand (aluminum silicate) as well as other debris discovered in the oil sample were responsible for the abnormally high wear. Since abrasive wear was the main cause of premature aging and resulted in severe damage to the parts in contact with these objects, the maintenance engineer wanted the reason for the initial ingress of those particles into the system to be investigated.
For the sampler, it was essential to ensure that as much evidence as possible was captured in the drawn sample. In this case, where the ultimate failure would have been catastrophic, the task could have been quite difficult, since all particles had settled to the bottom as the oil cooled. Thus, a typical sample drawn in the normal fashion may not have allowed all the evidence to be captured.
Particles as Friends
By unlocking the treasure of evidence that was captured in the particles found in the oil, the diagnostician obtained information about the formation of such particles. The presence of metal shavings indicated possible misalignment. Lack of lubrication also was detected, which possibly was due to blocked oil channels resulting from the presence of foreign particles. The metallic iron shaving with lead bound to it suggested welding due to oil starvation (metal-to-metal contact).
The discovery of a particle with scratch marks led to an investigation of objects that could have been responsible for the damage. One possible culprit was detected in a particle consisting of calcium phosphate and calcium silicate. This specific mineral (possibly apatite) together with particles containing quartz and sand led to the conclusion that the engine originated from a locomotive that was involved in an accident with subsequent derailment where soil was introduced to the engine. Evidently, the soil was not removed successfully when the engine was refurbished.
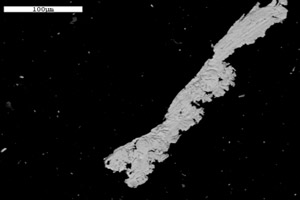
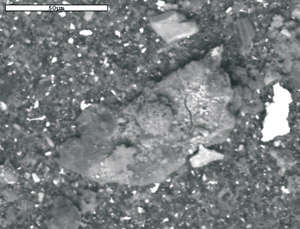
An iron shaving with scratch marks (top) and soil (above) were found in the oil sample.
Case Study #3: Wrist Pin Bearing Failure on a Diesel Locomotive
Prior to a wrist pin bearing failure, oil samples from a diesel locomotive were sent to two different laboratories for routine oil analysis. The first laboratory issued wear alerts on possible wrist pin bearing wear four weeks prior to the failure, while the second laboratory indicated no abnormal wear was taking place. A resample was taken, and again the second lab did not find any abnormal wear, while the first lab issued another wear alert.
The fleet owner decided to stop the locomotive to find out whether the alerts issued by the first laboratory were justified. It was discovered that the wrist pin bearing had failed with damage to four power packs. An investigation was launched to determine the root cause that resulted in the different diagnoses from the two laboratories.
Routine oil monitoring tests were performed, including spectrometric analysis using RDE spectrometry and PQ. An EDX analysis using the SEM on the filter debris was conducted after the sample was filtered through a 0.8-micron-filter membrane and rinsed with pentane to remove oil residue. The results of the RDE spectrometric analysis revealed an increase in silver, copper and iron, while the SEM analysis confirmed the presence of particles larger than 10 microns.
Since both laboratories performed similar analysis on a routine basis, the investigation focused on the differences in the techniques used by the two labs. The only major difference found was that the laboratories employed different spectrometric techniques to determine the wear metal content of the samples, namely ICP and RDE spectrometry.
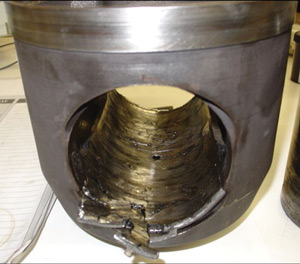
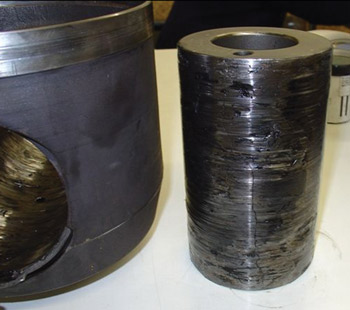
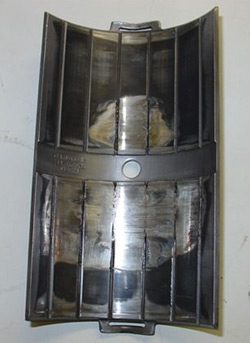
These images of a locomotive engine
reveal wrist pin bearing failure.
The primary variation between the two techniques is the way the sample is introduced to the system. For ICP analysis, the sample is diluted prior to introduction to the instrument. Therefore, it’s possible that the particles settled prior to analysis. The ICP also uses a peristaltic pump and transport system, which is subject to blockages.
In addition, the size limitation of the ICP is 1 to 3 microns, while the range of the RDE is 8 to 10 microns. The SEM analysis confirmed the presence of particles larger than 5 microns, so it seems the failure progressed beyond the point where the ICP could detect the wear particles but remained within the range of the RDE.
Case Study #4: Scored Liner and Piston Wear on a Diesel Locomotive
As part of an oil analysis program, the crankcase oil of a locomotive was monitored on a monthly basis. However, no samples were received for the period between January and the end of June. The engine failed at the end of September.
The reason for concern was that all laboratory reports returned with no indication of an increase in wear metal content. An investigation was initiated to explain why the laboratory tests failed to detect any increase in wear when it was evident that abnormal wear was taking place from the mechanical failure that occurred.
Since no abnormalities were found except for fuel dilution over a prolonged period, the investigation focused on sampling intervals and techniques that could have affected the results.
Routine oil monitoring tests, including spectrometric analysis using RDE spectrometry, were performed, as well as EDX analysis using the SEM on the filter debris after the sample was filtered through a 0.8-micron-filter membrane and rinsed with pentane to remove oil residue.
The results showed severe fuel dilution. The RDE spectrometry indicated no increase in metal content since the previous sample was analyzed. The EDX analysis revealed that isolated large particles (larger than 20 microns) of heavy metals and other inorganic oxides were present on the filter. Many of the larger particles were iron or iron oxides. The small particles consisted mainly of calcium sulphate.
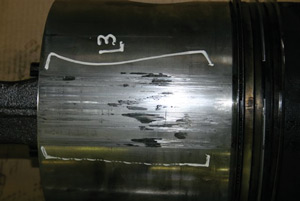
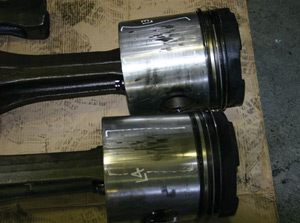
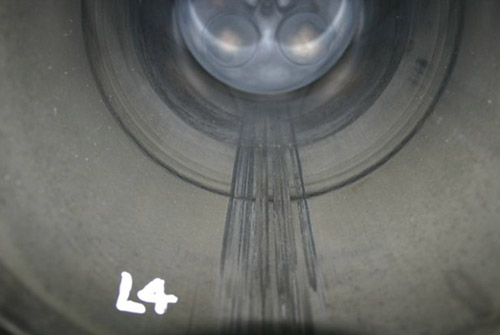
These photos of a locomotive engine indicate a severely scored liner and piston wear.
Lowering of the fluid’s viscosity, which may have resulted from fuel dilution in the engine, aggravated the tendency of particles to settle. Therefore, it is possible that suspended particles had settled to the bottom of the sump and were not included in the sample.
In the earlier stages of failure, smaller particles were produced (likely during the period when no samples were submitted). As the failure progressed, the size of the particles increased. Since particles larger than 10 microns were found, it is possible that the failure progressed beyond the point where the RDE could detect the wear particles. Thus, severe fuel dilution over a prolonged period of time combined with not submitting oil samples at the initial stages of failure resulted in the inability to detect the failure through a routine oil analysis program.
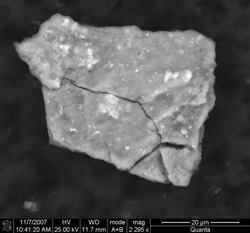
A particle larger than 20 microns
was found in the oil sample.
In conclusion, it is apparent that removal of particles from a system prior to sampling by means of indiscriminate filtration, improper sample handling and settling of particles can result in the loss of important evidence that could lead to the early detection of possible failures or assist in root-cause analysis.
Remember, the purpose of oil analysis is to avoid failure before it happens. Sensitivity with regards to particle sizes and size limitations of analytical techniques relative to sampling intervals is vital to reach this ultimate goal. In the end, the success of an oil analysis program to detect possible failure modes relies on the ability of the mechanical engineer, tribologist, sampler, analyst and diagnostician to treat and react to the presence of particles in the appropriate manner.


